

How to Check FPS on PC: 6 Easy and Reliable Methods
The Quick Answer
The easiest way to check FPS on a Windows PC is to enable the counter built into the game. If the game does not provide one, use the Steam Performance Overlay, Windows Game Bar, NVIDIA App statistics overlay or AMD Software metrics overlay.
For a quick check, watch the counter while playing. For a useful performance comparison, repeat the same scene three times and record average FPS, 1% low FPS, resolution, graphics settings and upscaling mode. A single number captured in a menu or an unusually quiet scene does not describe normal gameplay.
Estimate FPS for a planned CPU, GPU and game configuration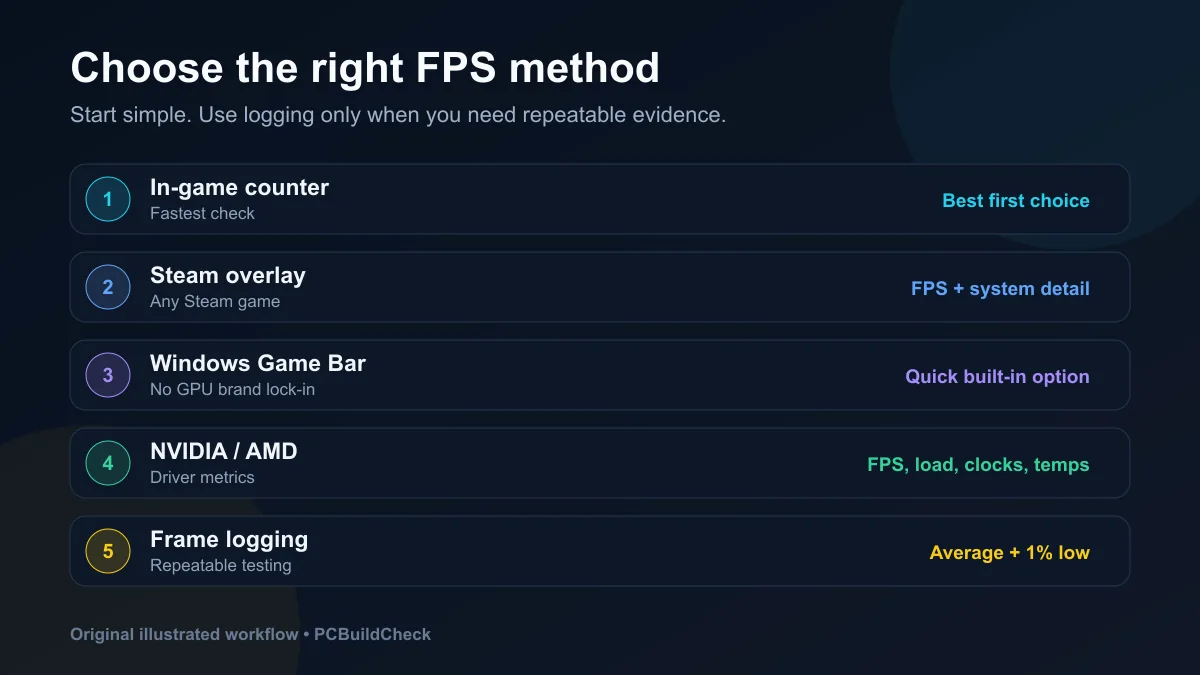
Which FPS Method Should You Use?
Start with the simplest method that answers your question. Installing a detailed monitoring package is unnecessary if you only want to confirm that a game is reaching 60 FPS.
| Method | Best use | What it can show | Main limitation |
|---|---|---|---|
| Game's own counter | Fastest compatibility check | Usually current or average FPS | Options and definitions vary by game |
| Steam Performance Overlay | Steam games and basic diagnosis | FPS, frame graph and optional hardware detail | Requires the Steam overlay to work in that game |
| Windows Game Bar | Convenient built-in Windows option | FPS plus CPU, GPU and RAM usage | The widget may need permission or an initial setup |
| NVIDIA App | Systems using supported NVIDIA graphics | FPS, 1% low and selected system statistics | Available metrics depend on hardware and the game |
| AMD Software | Systems using supported Radeon graphics | FPS, frame time, utilization, clocks and temperatures | Requires a compatible Radeon system and full software install |
| Frame logging | Repeatable comparisons and stutter analysis | Average FPS, lows and per-frame data | Takes longer and requires consistent test conditions |
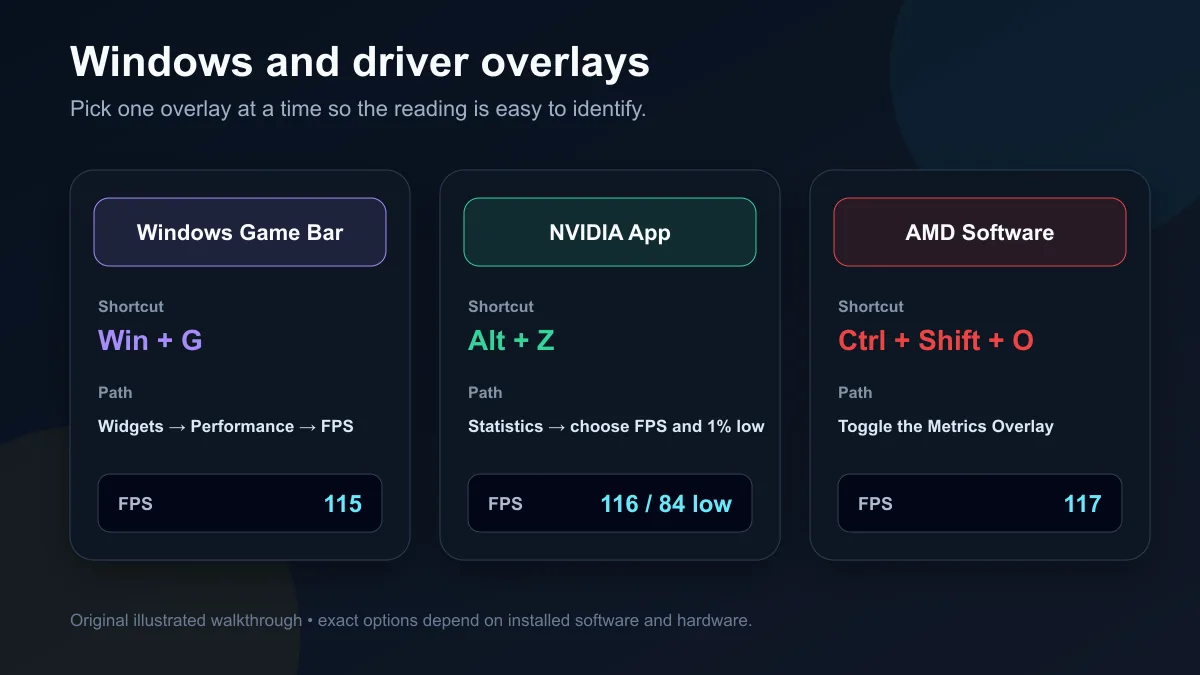
If two counters are visible, disable one. Otherwise you may mistake one overlay for another or compare metrics calculated in different ways.
FPS Counter vs FPS Test vs FPS Calculator
These terms describe three different jobs. An FPS counter displays what the game is producing now, an FPS test records performance under repeatable conditions, and an FPS calculator estimates what a planned hardware and settings combination may deliver. Choosing the right method prevents an estimate from being mistaken for a measured benchmark.
| Method | Question it answers | Best time to use it | What it cannot prove |
|---|---|---|---|
| FPS counter | “What frame rate am I seeing right now?” | While playing a game you already own | Performance across every map, scene or future patch |
| FPS test | “How does this PC perform in the same repeatable workload?” | When comparing settings, drivers, temperatures or an upgrade | Results for hardware or games you did not test |
| FPS calculator | “What FPS range might this planned setup produce?” | Before buying hardware or installing a game | The exact frame rate of your individual PC |
Use the FPS Calculator when you are still comparing components or settings. If you want to check whether a particular game suits your PC, start with the Can I Run It game directory, then confirm the result with a counter or repeatable test after installation.
For smoother-performance analysis, convert FPS to milliseconds with the Frame Time Calculator and compare the result with your display using the FPS and Refresh Rate Calculator.
Method 1: Use the Game's Built-In FPS Counter
This is normally the best first choice because the game developer knows how its menus and renderer are structured. Look in sections such as:
- Open Settings or Options.
- Check Display, Graphics, Video, Interface or Telemetry.
- Look for Show FPS, Performance Metrics, Frame Rate Counter or Telemetry.
- Enable the smallest counter first.
- Return to active gameplay—not the pause menu—and check several different scenes.
Some games provide more than FPS. Counter-Strike 2 and Deadlock, for example, include a Source 2 telemetry HUD that can show frame time alongside average frame rate. Valve explains that the millisecond value represents the time between presented frames, while the FPS value is the average frame rate in that HUD. See the official Steam Source 2 telemetry documentation.
Built-in benchmarks are especially useful because they follow the same camera path on every run. They are still representative of that benchmark scene—not every multiplayer match, map or open-world area.
Method 2: Enable the Steam Performance Overlay
Steam's newer performance monitor is more capable than the original single-number FPS counter. Valve says it can provide four levels of detail, ranging from one FPS value to FPS, CPU, GPU and RAM information. It can also distinguish generated frames from game-rendered frame rate when the required game and hardware data are available.
To enable it:
- Open the Steam desktop client.
- Select Steam → Settings.
- Open In Game.
- Find the Performance Overlay section.
- Choose a level of detail. Start with Single FPS Value or FPS Details.
- Select a screen position and adjust text size or background opacity if needed.
- Launch the game through Steam and confirm the overlay appears during gameplay.
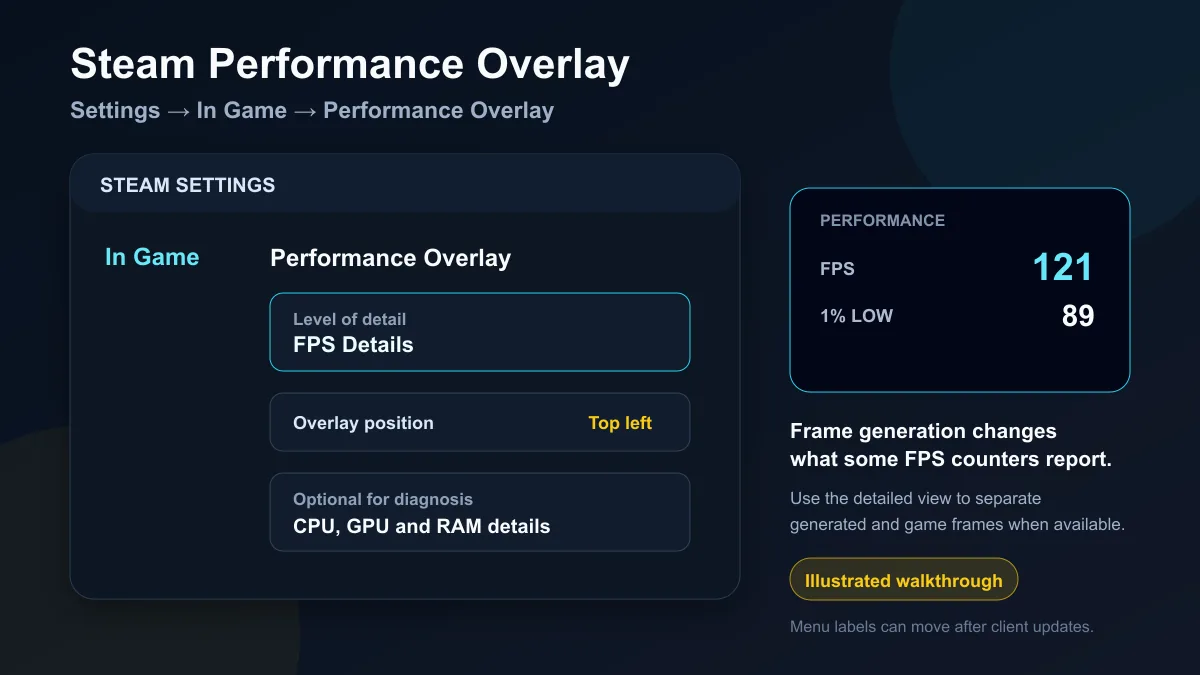
Valve's Steam performance monitor announcement documents the settings path and explains the different detail levels. Menu labels can change after client updates, so use the Settings search if the section moves.
Method 3: Use Windows Game Bar
Game Bar is useful when a game has no counter and you do not want a GPU-brand-specific tool.
- Start the game.
- Press Windows key + G.
- Open the Widgets menu.
- Select Performance.
- Enable FPS and disable unneeded metrics if you want a compact display.
- Use the pin button to keep the widget visible after closing the main Game Bar.
- Return to the game and test an active scene.
Microsoft documents Win + G as the shortcut used to open Game Bar and load its widgets. See Using Game Bar with widgets.
On first use, Windows may request access for FPS information or ask you to restart. If the counter stays blank, update Game Bar through Microsoft Store, restart Windows, then test another supported game before assuming the PC has a performance fault.
Method 4: Use the NVIDIA App Statistics Overlay
For a supported NVIDIA system, the NVIDIA App overlay can combine FPS with hardware statistics.
- Open the NVIDIA App and confirm its in-game overlay is enabled.
- Launch the game.
- Press Alt + Z to open the NVIDIA Overlay.
- Open Statistics.
- Select the statistics you need, such as FPS, 1% low, GPU utilization or latency where supported.
- Choose a position, text size and color that remain readable over the game.
- Close the overlay and check the pinned statistics during play.
NVIDIA describes its updated overlay as supporting real-time FPS and performance statistics, including options such as GPU and CPU utilization, FPS 1% low and latency on supported configurations. The current feature overview is available on the official NVIDIA App page.
Do not enable every metric at once. A compact FPS and 1% low readout is better for playing; a larger overlay with utilization, temperature and clocks is better for diagnosing why performance is limited.
Method 5: Use AMD Software Metrics Overlay
AMD Software: Adrenalin Edition can show and log performance statistics on compatible Radeon systems.
- Open AMD Software.
- Search for Metrics and open Performance Metrics.
- Select the metrics you want to display.
- Configure the overlay location, size and transparency.
- Launch the game.
- Press Ctrl + Shift + O to toggle the metrics overlay using AMD's documented default shortcut.
- For a recorded test, use Ctrl + Shift + L to start or stop performance logging if that default shortcut is still assigned.
AMD's official Performance Metrics guide lists frame rate, frame time, 99th-percentile FPS, stutter rate, utilization, clocks, temperatures, power and memory statistics among the available metrics. The exact selection depends on the installed hardware and software version.
Method 6: Log a Repeatable Test
A live counter answers “What am I seeing right now?” Logging answers “Did this settings change actually improve performance?” Use a built-in benchmark where possible. Otherwise create a repeatable 60–120 second route.
A Practical Test Procedure
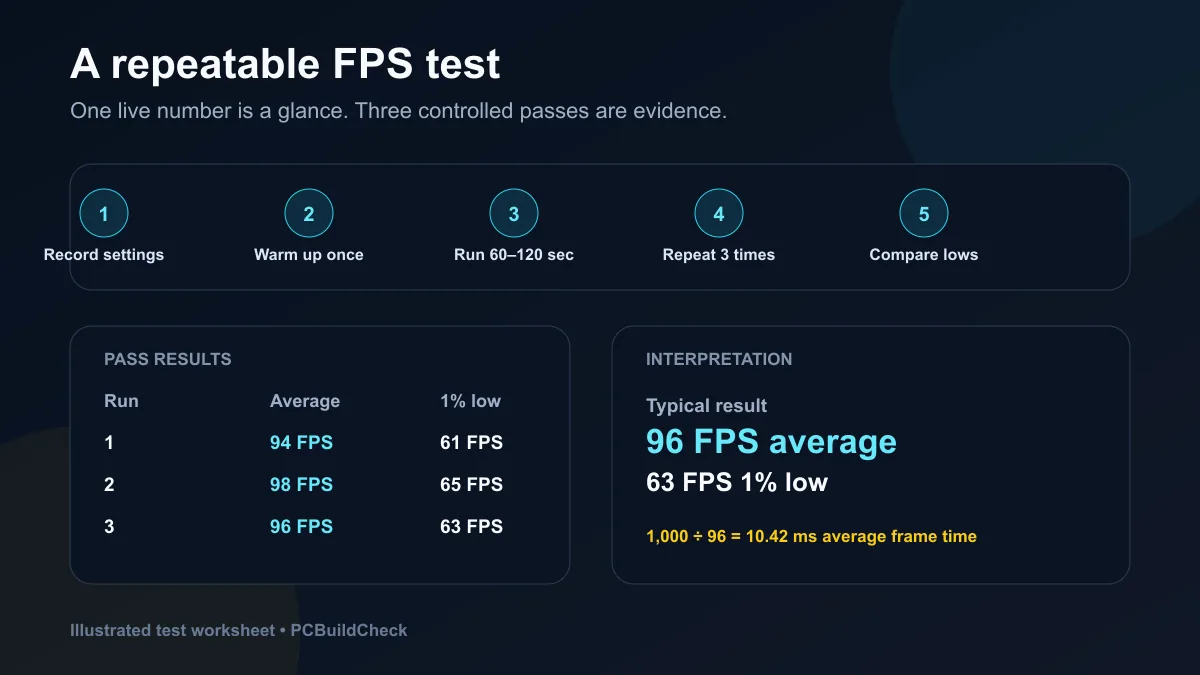
- Record the game version, resolution, display mode, preset, ray tracing, upscaling, frame generation, V-Sync and frame cap.
- Close avoidable background downloads and applications.
- Let shader compilation finish.
- Run the scene once as a warm-up without recording the result.
- Capture the same route for 60–120 seconds.
- Repeat it three times without changing settings.
- Compare average FPS and low-percentile performance.
- If one run is an obvious outlier, identify the cause before discarding it.
NVIDIA's standalone FrameView is one option for deeper logging across supported graphics hardware. Its official guide describes average FPS, 1% low FPS, PC latency and hardware metrics, with log files for later analysis. See the FrameView 1.9 user guide.
Worked Example
Suppose three identical passes produce:
| Test run | Average FPS | 1% low FPS | Observation |
|---|---|---|---|
| 1 | 94 | 61 | Slight shader or asset-loading activity |
| 2 | 98 | 65 | Fastest pass |
| 3 | 96 | 63 | Close to the middle |
| Typical result | 96 | 63 | A reasonable summary of these runs |
The average frame-time equivalent of 96 FPS is:
Frame time = 1,000 ÷ FPS
1,000 ÷ 96 = 10.42 milliseconds
The 63 FPS 1% low is materially below the 96 FPS average, so the experience contains a slower tail that the headline average does not show. It does not automatically prove a CPU bottleneck, insufficient RAM or a bad GPU. Inspect the frame-time graph, temperatures, utilization, memory use and the exact scene before diagnosing the cause.
How to Get a Fair FPS Reading
Use these controls whenever you compare settings, drivers or hardware:
| Keep constant | Why it matters |
|---|---|
| Same scene or benchmark route | Different locations can have radically different CPU and GPU load |
| Same resolution and render scale | Pixel workload directly affects GPU demand |
| Same quality settings | Preset names alone can hide individual changes |
| Same upscaling and frame-generation state | These features change what is rendered and what may be displayed |
| Same frame cap and synchronization | V-Sync, caps and refresh behavior can limit the observed number |
| Similar temperature state | A cold first run and heat-soaked later run may boost differently |
| Same background workload | Updates, browser tabs and recording software consume resources |
For a quick health check, perfection is unnecessary. For a before-and-after claim, consistency matters more than collecting a large number of random readings.
Common Problems and Fixes
The Counter Shows N/A or Zero
- Confirm that the overlay is enabled globally and for that game.
- Test borderless windowed mode if exclusive fullscreen blocks the overlay.
- Update the game launcher or GPU software.
- Disable other overlays temporarily to check for conflicts.
- Restart the application after changing overlay settings.
The Counter Appears on the Desktop but Not in the Game
The overlay may not support that graphics API, display mode or protected application. Try the game's built-in counter first, then a different supported overlay. Do not disable security features or anti-cheat protections to force an overlay into a game.
FPS Is Exactly 60, 120 or 144
Check the in-game frame cap, V-Sync, driver-level caps and refresh-rate settings. A stable round number often indicates an intentional limit rather than the maximum performance of the PC.
The FPS Number Is High but the Game Feels Uneven
Average FPS can hide long frames. Check 1% low performance or a frame-time graph. Shader compilation, asset streaming, memory pressure, background activity and thermal throttling can create visible interruptions without destroying the overall average.
Different Counters Disagree
Counters may sample different stages of the rendering pipeline, use different averaging windows or treat generated frames differently. Compare like with like and document the tool used. A difference of a few FPS is usually less important than a large difference in test conditions.
Measured FPS Versus Estimated FPS
An online FPS calculator cannot read your finished PC or measure a live game session. It estimates a planning range from selected hardware, game and settings. An overlay measures the system that is actually running, but only for the scene and conditions being observed.
Use them together:
- Use the FPS Calculator before buying or changing hardware.
- Record its range and assumptions.
- Measure the finished configuration with one of the methods above.
- If the real result is well outside the range, verify settings and investigate temperatures, memory configuration, power limits and background activity.
The separate gaming FPS estimation guide explains why CPU and GPU ceilings, resolution, quality settings, patches and frame generation prevent any calculator from guaranteeing one exact result.
For repeatable high-refresh examples, start with the Counter-Strike 2 PC and FPS guide or the Apex Legends PC requirements guide, then record the same route and settings on your own system.
Final Recommendation
For most PC gamers, use this order:
- Enable the game's own FPS counter.
- Use Steam's simple overlay when playing through Steam.
- Use Game Bar when you need a convenient Windows option.
- Use NVIDIA or AMD metrics when diagnosing hardware behavior.
- Log three repeatable passes when comparing settings or upgrades.
Keep the test simple enough to repeat and detailed enough to reproduce. Record the tool, scene and settings beside the number. “96 FPS average, 63 FPS 1% low at 1440p High in a repeatable 90-second route” is useful evidence; “around 100 FPS somewhere in the game” is not.
Editorial Method and Sources
The procedure, decision table, three-pass worksheet, calculations and instructional graphics in this guide are original PCBuildCheck material. The interface illustrations are walkthroughs—not pixel-for-pixel copies—and menu labels can change after software updates.
Primary references:
- Microsoft: Using Game Bar with widgets
- Valve: Steam Performance Monitor announcement
- Valve: Source 2 Telemetry HUD
- NVIDIA App performance overlay
- NVIDIA FrameView 1.9 user guide
- AMD Software Performance Metrics guide
This guide was reviewed on August 16, 2026.
Continue your PC planning
Use the guide as context, then test the decision with a focused calculator, game workload or worked build example.
Relevant calculators
Relevant game checks
Share this article
Related Articles
How to Estimate Gaming FPS—and Why FPS Calculators Have Limits
A calculation-first guide to estimating average FPS and 1% lows, identifying CPU and GPU limits, and understanding where predictions stop being reliable.
How to Check for PC Bottlenecks: Step-by-Step Guide
Is your PC not performing as expected? Learn how to detect and fix CPU, GPU, and RAM bottlenecks with our comprehensive step-by-step guide.