

How to Estimate Gaming FPS—and Why FPS Calculators Have Limits
The Short Answer
You can estimate gaming performance by starting with a relevant benchmark or calibrated reference result, then adjusting it for the CPU, GPU, resolution, quality preset and performance features in your intended system. The result should be a range, not a promise.
A useful first approximation is:
Estimated FPS =
reference FPS
× hardware factor
× resolution factor
× quality factor
× supported feature factors
That formula is useful for planning, but a real game does not run as one neat equation. A crowded city can be CPU-limited while an indoor scene in the same game is GPU-limited. A patch can change performance. Ray tracing, memory pressure, shader compilation, background processes and thermal limits can all move the result.
The safest interpretation is therefore:
Calculator result = reasonable planning range
Repeatable benchmark = evidence for one exact configuration
Use an estimate to compare possible builds and set expectations. Use measurements from the finished PC to diagnose its actual performance.
Estimate a configuration with the Gaming FPS CalculatorTo isolate settings-related changes, calculate the pixel workload with the Resolution Scaling Calculator, then compare practical presets in the Game Settings Optimizer.
FPS Is Easier to Understand as Frame Time
Frames per second counts how many completed frames are presented over a second. Frame time describes how long one frame takes. At a perfectly steady rate, the two are mathematical inverses:
Frame time in milliseconds = 1,000 ÷ FPS
FPS = 1,000 ÷ frame time in milliseconds
The relationship is not linear. Moving from 30 to 60 FPS saves 16.67 milliseconds per frame, whereas moving from 120 to 150 FPS saves only 1.67 milliseconds.
| Frame rate | Time budget per frame | Improvement from previous row |
|---|---|---|
| 30 FPS | 33.33 ms | — |
| 60 FPS | 16.67 ms | 16.66 ms |
| 90 FPS | 11.11 ms | 5.56 ms |
| 120 FPS | 8.33 ms | 2.78 ms |
| 144 FPS | 6.94 ms | 1.39 ms |
| 165 FPS | 6.06 ms | 0.88 ms |
| 240 FPS | 4.17 ms | 1.89 ms |
| 360 FPS | 2.78 ms | 1.39 ms |
This table explains why “30 FPS more” does not always represent the same improvement. It also shows how demanding high-refresh gaming becomes: a 240 FPS target gives the entire system only about 4.17 ms to process game logic, prepare draw calls, render the image and present it.
Average FPS Does Not Describe Smoothness
Imagine two 10-frame samples. Both average 100 FPS, or 10 ms per frame:
| Sample | Individual frame times | Average |
|---|---|---|
| A: even delivery | 10, 10, 10, 10, 10, 10, 10, 10, 10, 10 ms | 10 ms / 100 FPS |
| B: uneven delivery | 5, 5, 5, 5, 5, 5, 5, 5, 20, 40 ms | 10 ms / 100 FPS |
Sample B contains a clearly visible 40 ms interruption even though its average is identical. That is why a useful performance report should consider:
- Average FPS: overall throughput during the captured run.
- Frame-time graph: whether frames arrive evenly or contain spikes.
- Low-percentile performance: a summary of the slower portion of the run.
- Test context: scene, route, duration, settings, game version and hardware state.
“1% low FPS” is commonly used, but it is not a universal raw measurement with one mandatory calculation. Tools can derive or label percentiles differently, and an FPS percentile is not interchangeable with the same-numbered frame-time percentile because lower FPS is worse while higher frame time is worse. The open-source PresentMon documentation exposes per-frame timing and distinguishes statistics explicitly. When comparing reviews, check the methodology rather than assuming every “1% low” was produced identically.
On this site, the displayed 1% low from an online estimate is a stability planning value derived from the estimated average. It is not a captured percentile from a real test. Its purpose is to warn that momentary performance is likely to be lower than the headline average.
A Practical Mental Model: Three Performance Ceilings
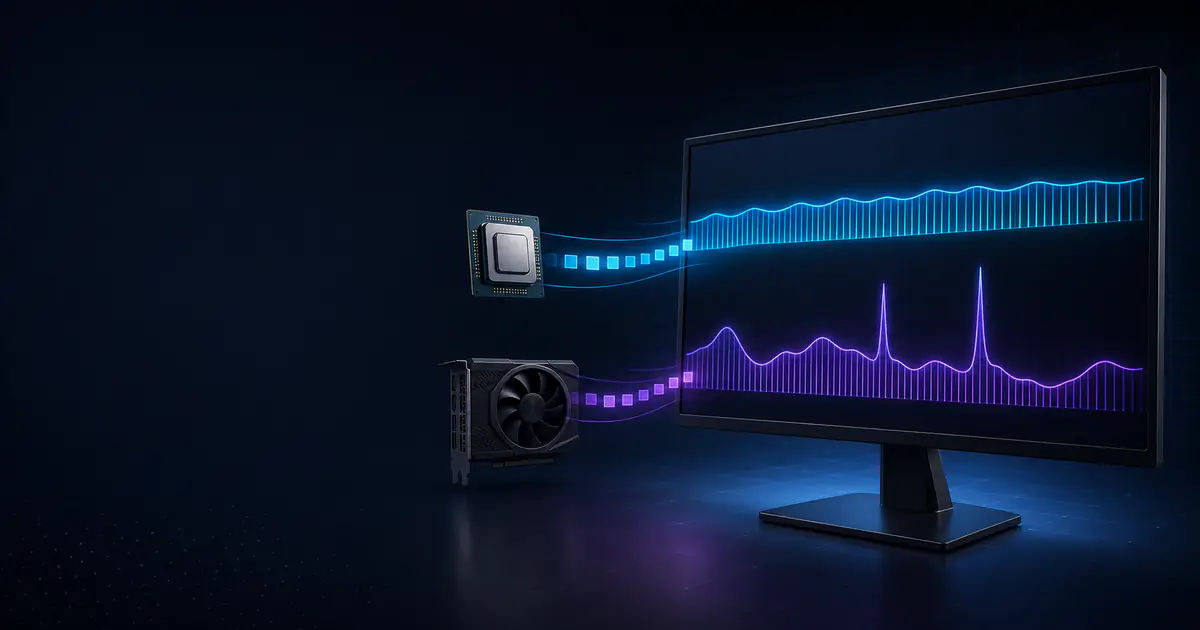
The game loop has work for both the CPU and GPU. The CPU handles tasks such as simulation, draw-call preparation, animation, physics and parts of asset streaming. The GPU executes graphics and compute work such as geometry, rasterization, shading, lighting and post-processing. The engine may also impose its own frame cap.
For teaching purposes, think of the attainable result as the lowest of three ceilings:
Attainable FPS ≈ minimum of:
CPU-side ceiling,
GPU-side ceiling,
engine or configured frame cap
Suppose a scene has a 125 FPS CPU ceiling:
| GPU option | GPU-side capacity | CPU-side ceiling | Estimated attainable FPS |
|---|---|---|---|
| GPU A | 90 FPS | 125 FPS | about 90 FPS |
| GPU B | 140 FPS | 125 FPS | about 125 FPS |
| GPU C | 190 FPS | 125 FPS | about 125 FPS |
GPU B gives a large improvement over GPU A. GPU C does not improve this scene much because the CPU-side work is now the lower ceiling. In a graphically heavier scene, or at 4K, GPU C may again pull ahead.
Microsoft’s DirectX team describes CPU- and GPU-boundedness in similar terms: the component taking longer to produce its part of a frame limits the rate. Their CPU and GPU boundedness guide also stresses that different games have different performance characteristics.
How to Identify the Likely Limit
Run the same repeatable scene while lowering the resolution substantially:
- If FPS rises strongly, the GPU was probably a major limit.
- If FPS changes little, CPU-side work, a frame cap or another system constraint is more likely.
- If average FPS stays similar but stutters disappear after lowering textures, memory pressure may have mattered.
- If clocks fall as temperatures rise, cooling or power limits may be reducing sustained performance.
GPU utilization alone is helpful but not conclusive. A frame cap, menu, loading transition, CPU limit or synchronization behavior can prevent full utilization. Diagnose with several signals rather than one percentage.
Resolution Math: Pixel Count Is a Starting Point
Resolution changes how many output pixels must be produced for every frame. These exact pixel counts provide a useful lower-level comparison:
| Resolution | Pixel dimensions | Pixels per frame | Relative to 1080p |
|---|---|---|---|
| Full HD | 1,920 × 1,080 | 2,073,600 | 1.00× |
| QHD | 2,560 × 1,440 | 3,686,400 | 1.78× |
| Ultrawide QHD | 3,440 × 1,440 | 4,953,600 | 2.39× |
| 4K UHD | 3,840 × 2,160 | 8,294,400 | 4.00× |
If a workload were perfectly GPU-limited and cost scaled exactly with output pixels, a 120 FPS 1080p result would become:
1440p: 120 ÷ 1.78 = 67.4 FPS
3440×1440: 120 ÷ 2.39 = 50.2 FPS
4K: 120 ÷ 4.00 = 30.0 FPS
Treat those as pessimistic teaching values, not a general benchmark rule. Many costs do not scale directly with pixel count. CPU simulation may barely change. Geometry processing, some shadows and asset work scale differently. Memory bandwidth, cache behavior, a frame cap and engine optimizations also affect the curve. This is why our calculator uses calibrated resolution factors rather than simply dividing by the pixel ratio.
The current planning factors are:
| Output resolution | Calculator factor | 120 FPS reference becomes |
|---|---|---|
| 1080p | 1.00 | 120 FPS |
| 1440p | 0.76 | 91 FPS |
| 4K | 0.44 | 53 FPS |
These factors describe a mixed real-world workload more plausibly than perfect pixel scaling, but they are still broad assumptions. A heavily GPU-bound ray-traced game may lose more; an esports game hitting a CPU ceiling may lose much less.
Quality Settings Do Not Cost the Same Amount
Preset names are not standardized. “Ultra” in one game can be close to “High”; in another it may enable expensive shadows, volumetrics or ray tracing. Texture quality often changes memory use more than raw shader workload until VRAM capacity is exceeded. The VRAM requirements guide explains capacity, allocation and memory budgets with a separate planning worksheet. Geometry distance can increase both CPU and GPU demand.
Use this order when trying to recover performance:
| Setting group | Common primary pressure | Practical adjustment |
|---|---|---|
| Ray-traced lighting/reflections | GPU compute and memory | Reduce first if the FPS loss is large |
| Resolution scale | GPU shading and bandwidth | Lower gradually or enable supported upscaling |
| Volumetrics and shadows | Mostly GPU; sometimes CPU draw work | Move down one step and retest |
| View distance/crowd density | Often CPU plus GPU geometry | Reduce when lowering resolution does little |
| Textures | VRAM capacity and bandwidth | Keep high if memory is sufficient; lower if paging/stutter appears |
| Motion blur/film grain | Usually small performance effect | Choose for visual preference |
A quality preset is convenient for estimating, but individual settings are better for tuning. Start with High, measure, then spend the remaining frame-time budget on the features you value.
Upscaling and Frame Generation Need Separate Labels
Temporal upscalers can reconstruct a higher-resolution output from a lower-resolution input plus motion and history data. AMD’s official FSR 2 documentation describes this lower-resolution-input approach. Because fewer input pixels are rendered, a GPU-limited workload can gain performance, but the uplift and image quality depend on the game, mode, output resolution and implementation.
For a simple supported-upscaling example:
Native estimate = 55 FPS
Illustrative upscaling factor = 1.25
55 × 1.25 = 68.75, rounded to 69 FPS
That does not mean every Quality mode is worth exactly 25%. An existing CPU ceiling may prevent most of the gain.
Frame generation is a different feature. It inserts generated frames between application-rendered frames. Recent PresentMon releases distinguish FPS-App, FPS-Presents and FPS-Display, particularly for frame-generation scenarios. AMD’s FSR frame-generation documentation likewise treats frame generation separately from upscaling.
Therefore, a responsible result should say whether it means:
- native application-rendered FPS;
- upscaled application-rendered FPS; or
- displayed FPS including generated frames.
A displayed-frame counter that includes generated frames should not be silently compared with a native-rendering benchmark. Image fluidity can improve, while input sampling and game simulation still depend on the underlying rendered rate and the rest of the latency pipeline.
How This FPS Calculator Produces a Planning Range
Our model starts with a per-game reference at 1080p High using native rendering. It then applies a weighted CPU/GPU hardware scale, resolution and quality factors, supported upscaling and anti-aliasing modifiers, plus planning penalties for estimated VRAM or RAM shortfalls. It also considers memory speed and storage through deliberately small modifiers.
The hardware portion uses a weighted geometric relationship:
CPU scale = selected CPU index ÷ reference CPU index
GPU scale = selected GPU index ÷ reference GPU index

Hardware factor =
(CPU scale ^ CPU weight)
× (GPU scale ^ GPU weight)
A CPU-heavy competitive game receives a larger CPU weight than a graphically demanding single-player title. At higher resolutions, the model shifts more of the weight toward the GPU. Scores and factors are capped to avoid pretending that performance scales indefinitely.
Worked Model Example
Consider a game with a 150 FPS reference, 55% CPU weight and 45% GPU weight. The chosen CPU has a relative scale of 0.90 and the GPU a relative scale of 1.05:
Hardware factor =
(0.90 ^ 0.55) × (1.05 ^ 0.45)
= 0.944 × 1.022
= 0.965

1080p High estimate:
150 × 0.965 × 1.00 × 1.00
= 144.8, rounded to 145 FPS
At 1440p using the broad 0.76 resolution factor:
145 × 0.76 = 110 FPSIf the selected supported upscaling mode has a 1.18 planning factor:
110 × 1.18 = 129.8, rounded to 130 FPSThe output is then shown with uncertainty. For a non-speculative profile, a 130 FPS midpoint and 13% range produce:
Lower planning bound = 130 × 0.87 = 113 FPS
Upper planning bound = 130 × 1.13 = 147 FPS
The site might display 113–147 FPS, planning midpoint 130 FPS. That is more honest than displaying 130 as if it were a laboratory measurement.
Three More Practical Estimation Examples
1. A CPU-Limited Competitive Target
A player wants 240 FPS at 1080p Low. The GPU can theoretically produce 310 FPS in the selected scene, but comparable measurements suggest the CPU-side ceiling is 215 FPS:
minimum(215 CPU, 310 GPU, 300 game cap) = 215 FPSReplacing the GPU with one capable of 400 FPS still leaves the estimate at about 215 FPS. A faster CPU, faster memory subsystem or less CPU-heavy game settings would be the relevant changes. The 240 FPS target also requires a 4.17 ms frame-time budget, so occasional 6–8 ms frames can prevent consistent delivery even when the average looks close.
2. A GPU-Limited 4K Build
A native 4K High estimate is 58 FPS, while the CPU-side ceiling is well above 100 FPS. Reducing CPU-heavy crowd density may barely help. Reducing a costly lighting option by an illustrative 12% and enabling supported Quality upscaling with a 20% uplift gives:
58 × 1.12 × 1.20 = 77.95 FPSRound the estimate to about 78 FPS, then keep a range around it. The multipliers are not guaranteed to combine perfectly because settings can interact, but the calculation identifies the right tuning direction.
3. A VRAM-Constrained Configuration
Suppose the planned settings are expected to use around 10 GB of graphics memory, while the card has 8 GB. A calculator may apply a modest average-FPS penalty, but the real symptom can be more complicated: texture eviction, asset streaming, delayed frames or a sharp loss only in certain areas.
If an initial 82 FPS estimate receives an illustrative 11% capacity penalty:
82 × 0.89 = 73 FPSDo not interpret 73 FPS as a precise prediction of stutter. It is a warning to reduce texture or memory-heavy settings and seek exact-game testing with the same VRAM capacity.
Why No FPS Calculator Can Be Exact
Even a carefully calibrated model lacks variables that materially affect a finished run:
| Missing or uncertain variable | Why it changes the result |
|---|---|
| Game build and patch | Developers alter shaders, assets, CPU scheduling and settings |
| Exact scene | Crowds, effects, weather and viewing direction change workload |
| Driver and operating-system state | Optimization, shader caches and scheduling behavior vary |
| Cooling and power configuration | Sustained clocks can differ from short tests |
| Background activity | Updates, browsers, capture tools and overlays consume resources |
| Motherboard and memory tuning | Power limits, timings and channel configuration affect throughput |
| Card-specific design | Factory clocks, power limits and cooling vary within one GPU name |
| Frame cap and synchronization | In-game limits, V-Sync and external caps change observed FPS |
| Upscaler/game implementation | Modes and image reconstruction costs are title-specific |
| Measurement method | Route, warm-up, duration and percentile calculation affect reports |
New or unreleased games deserve even wider ranges. Requirements are not benchmarks, and trailer footage is not measurement data. If reliable PC performance evidence does not yet exist, a calculator can only extrapolate from engine expectations and stated requirements.
How to Validate the Estimate on Your PC
Use a repeatable test instead of watching a live counter during unrelated gameplay:
If you first need help enabling a counter or choosing a monitoring overlay, follow the practical how to check FPS on PC guide.
- Record the game version, driver, resolution, preset, upscaling, ray tracing and frame-generation state.
- Allow shader compilation to finish and run the route once as a warm-up.
- Choose a built-in benchmark or a 60–120 second route you can repeat consistently.
- Close avoidable background work and keep the same frame-cap and synchronization settings.
- Capture per-frame data, not only a screenshot of average FPS.
- Run at least three passes and compare them. A single outlier may be loading or background activity.
- Inspect average FPS, low-percentile behavior and the frame-time graph together.
- Monitor CPU/GPU temperatures, clocks, power and utilization for signs of throttling or a cap.
PresentMon can capture per-frame timing on Windows across DirectX, OpenGL and Vulkan and export CSV data for analysis. Its documentation also notes measurement limitations in some API and hardware-scheduling situations, which is a useful reminder that measurement tools themselves require context.
If measured performance is more than roughly 15–20% outside the planning range, check the test settings first. Then investigate RAM channel configuration, power limits, thermal throttling, VRAM pressure, an unsupported upscaling selection, background processes and whether the chosen scene is unusually CPU- or GPU-heavy.
The validation scene should match the workload: use our Cyberpunk 2077 PC guide for a graphics-heavy open-world example, or the Fortnite PC guide when comparing Performance Mode with Nanite and Lumen.
What Makes an Estimate Useful
A useful FPS estimate is transparent about its inputs, distinguishes rendered and generated frames, provides a range, explains the likely limiting component and makes it easy to reproduce the assumptions. More decimal places do not make an uncertain model more accurate.
Use the calculator to answer planning questions such as:
- Is 1440p High a realistic target for this class of build?
- Is the likely limit CPU-side or GPU-side?
- Would lowering resolution probably help?
- Is the monitor target plausible, or should I plan for a lower cap?
- Which configurations deserve closer benchmark research?
Do not use it to claim that a particular retail PC will deliver an exact frame rate in every scene. For a purchase decision, compare the estimate with recent benchmarks using the same game version, similar hardware and identical settings. After building, validate it with your own repeatable capture.
Compare your planned CPU, GPU, game and settingsEditorial Method and Sources
The calculations and worked scenarios in this guide are original planning examples created for PC Build Check. They are deliberately rounded to realistic reporting precision. Product-specific performance claims are not copied from vendor marketing, and the examples do not represent measured retail systems.
Primary technical references:
- Microsoft DirectX: CPU and GPU boundedness
- PresentMon project and measurement scope
- PresentMon console metrics and CSV documentation
- AMD FidelityFX Super Resolution 2 documentation
- AMD FidelityFX frame-generation documentation
This article explains the public methodology behind the estimator as of August 2, 2026. Model factors may be recalibrated when stronger game-specific evidence becomes available.
Continue your PC planning
Use the guide as context, then test the decision with a focused calculator, game workload or worked build example.
Relevant calculators
Relevant game checks
Share this article
Related Articles
How to Check for PC Bottlenecks: Step-by-Step Guide
Is your PC not performing as expected? Learn how to detect and fix CPU, GPU, and RAM bottlenecks with our comprehensive step-by-step guide.
How to Check FPS on PC: 6 Easy and Reliable Methods
A practical guide to displaying FPS, choosing the right overlay, measuring average and 1% low performance, and avoiding misleading tests.
CPU vs GPU Bottleneck: What's the Difference and How to Fix It
CPU bottleneck or GPU bottleneck? Learn the key differences, how each affects your gaming FPS, and the best strategies to resolve them.