

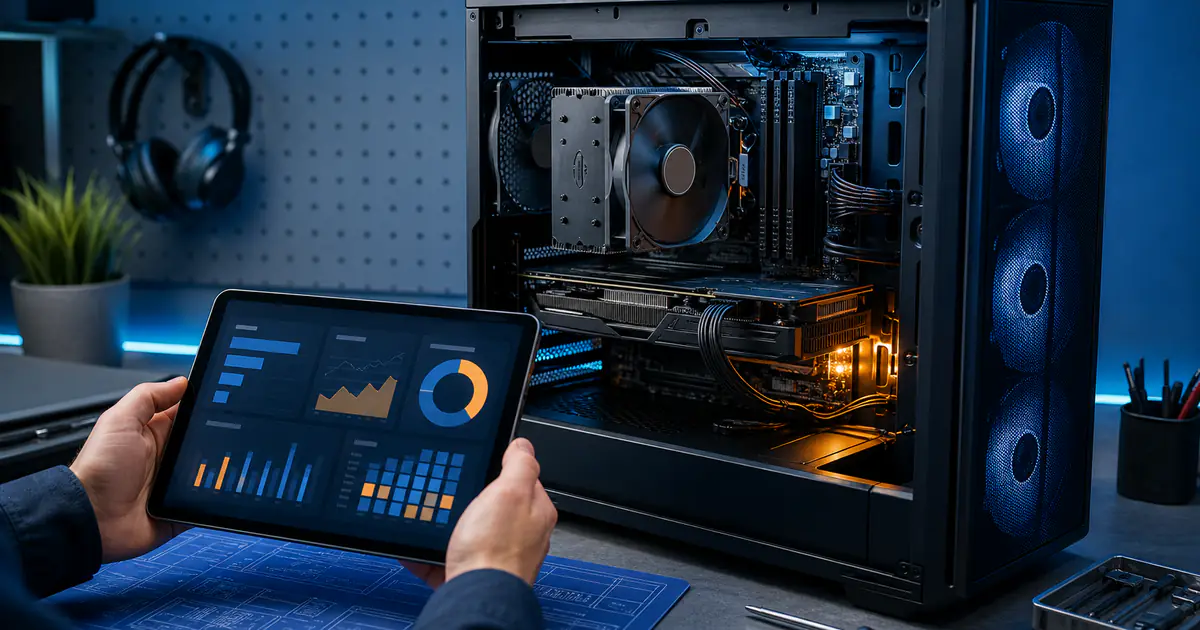
How to Check for PC Bottlenecks: Step-by-Step Guide
What Is a PC Bottleneck?
A bottleneck occurs when one component in your system limits the performance of another, preventing your PC from reaching its full potential. Think of it like a highway that narrows from four lanes to one — no matter how fast the cars are, they all have to slow down at the choke point.
In gaming PCs, the most common bottlenecks involve the CPU, GPU, and RAM. When these components aren't balanced, you'll experience lower FPS, stuttering, and poor overall performance — even if one of your components is top-of-the-line.
After identifying the likely constraint, use the PC Upgrade Priority Calculator to rank which component deserves attention first for your workload.
Signs You Have a Bottleneck
Before using diagnostic tools, treat these as clues rather than proof. Frame-rate caps, V-Sync, game-engine limits, drivers, temperatures, power settings, and background tasks can produce similar patterns:
- Low FPS despite having a powerful GPU — compare CPU, GPU, frame-time, settings, and game-specific benchmarks
- GPU usage below its usual range — first rule out frame caps, V-Sync, menus, driver issues, and light game workloads
- Frequent stuttering or frame drops — could be CPU, RAM, or storage related
- One or more CPU cores repeatedly saturated while the GPU is underused — may indicate a CPU-limited workload after other causes are excluded
- Games crashing or slowing when opening other apps — investigate memory pressure, drivers, temperatures, power, and software stability
- Long loading times despite having an SSD — check game files, drive health, available space, memory pressure, and background I/O
Step-by-Step: How to Detect a Bottleneck
Step 1: Use Windows Task Manager
The simplest starting point is built right into Windows. Here's how:
- Press
Ctrl + Shift + Escto open Task Manager - Click the Performance tab
- Launch a demanding game and play for a few minutes
- Alt-Tab back to Task Manager and observe:
| Component | What to Look For | Bottleneck Indicator |
|---|---|---|
| CPU | Overall usage, per-core usage, and clocks | One or more cores repeatedly saturated while frame time worsens |
| GPU | Utilization, clocks, power, and temperature | Near-full utilization plus FPS improvement when GPU-heavy settings are reduced |
| Memory | Usage, committed memory, and paging | Capacity pressure or paging that coincides with stutter |
| Disk | Active time and response time | Sustained high latency that coincides with asset-loading stalls |
Task Manager provides a quick overview, but for more granular data, you'll want a dedicated monitoring tool.
Step 2: Use MSI Afterburner + RivaTuner
MSI Afterburner combined with RivaTuner Statistics Server (RTSS) is one monitoring option that can show hardware statistics while gaming. Download monitoring tools only from their official source and review their settings before installation.
- Download and install MSI Afterburner (free)
- Open Settings → Monitoring tab
- Enable these metrics and check Show in On-Screen Display for each:
GPU usageGPU temperatureCPU usage(per-core if available)FramerateRAM usageFrame time
- Launch your game and monitor the overlay
How to read the overlay:
- One or more CPU cores saturated while GPU usage stays low → possible CPU limit after excluding caps, V-Sync, temperatures, and light workloads
- GPU near full utilization → the GPU may be the current limit; compare lower GPU-heavy settings to confirm
- Frame-time spikes → correlate them with memory, storage, temperatures, clocks, drivers, and background activity before assigning a cause
Example: Healthy vs Bottlenecked System

Healthy (GPU-limited):
  CPU Usage: 45%  |  GPU Usage: 98%  |  FPS: 120  |  Frametime: 8.3ms

CPU Bottleneck:
  CPU Usage: 97%  |  GPU Usage: 55%  |  FPS: 65   |  Frametime: 15.4ms

RAM Bottleneck:
  CPU Usage: 70%  |  GPU Usage: 75%  |  FPS: 80   |  Frametime: 12.5ms (with spikes to 35ms)
Step 3: Use the PC Build Check Calculator
For a quick, comprehensive analysis without installing any software, use our free bottleneck calculator:
- Select your CPU from the dropdown
- Select your GPU from the dropdown
- Choose your RAM configuration (amount and speed)
- Select your target resolution (1080p, 1440p, or 4K)
- Click Calculate to see your bottleneck analysis
The calculator shows a relative gap between internally normalized CPU and GPU scores. It is not a measured percentage of lost FPS and does not definitively identify the limiting component in every game. The CPU-versus-GPU bottleneck guide explains the two limiting patterns, while the FPS estimation guide shows why calculator output should be treated as a range.
Try the PC Build Check CalculatorHow to Fix a CPU Bottleneck
A CPU bottleneck means your processor can't keep up with your GPU. Here's how to address it:
- Lower CPU-intensive settings — Reduce draw distances, NPC counts, physics quality, and simulation settings
- Test multiple resolutions — Higher resolution usually increases GPU load and lowers FPS; comparing results can help identify which component reaches its limit first
- Test supported upscaling modes — DLSS, FSR, and XeSS render differently by game and mode; compare image quality, latency, and frame time rather than assuming a universal gain
- Use stock settings while diagnosing — Return CPU, GPU, and memory tuning to manufacturer defaults so instability or thermal limits do not distort the test
- Close background applications — Browsers with many tabs, Discord overlays, and streaming software all consume CPU cycles
- Consider a CPU upgrade only after testing — Compare independent benchmarks for your exact games, target settings, and platform cost
How to Fix a GPU Bottleneck
A GPU-limited result means the graphics workload reaches its limit before the CPU in that particular test. High utilization can be expected in demanding scenes, but it does not by itself prove that temperatures, power delivery, drivers, or frame times are healthy. If you want higher FPS:
- Lower graphical settings — Reduce shadows, anti-aliasing, volumetric effects, and post-processing
- Lower your resolution — Drop from 4K to 1440p, or 1440p to 1080p
- Compare supported DLSS / FSR / XeSS modes — They can improve FPS, but image quality and latency vary by game, mode, and resolution
- Update your GPU drivers — New driver releases often include game-specific optimizations
- Consider a GPU upgrade only after testing — Use repeatable benchmarks to confirm the card limits your target and compare total platform, power, and case requirements
How to Fix a RAM Bottleneck
RAM bottlenecks are less common but can cause severe stuttering:
| Issue | Solution |
|---|---|
| Not enough RAM (8GB in 2025) | Upgrade to 16GB or 32GB |
| Suspected memory-speed limit | Compare measured results with memory configurations supported by your CPU and motherboard |
| XMP/EXPO/DOCP profile | Treat it as optional memory tuning; verify platform support and stability before use |
| Single-channel configuration | Add a second stick for dual-channel |
| RAM timing issues | Use CPU-Z to verify timings match specs |
XMP, EXPO, and DOCP profiles change memory settings and may operate outside a processor's default memory specification. Benefits vary widely by workload and platform. Consult the CPU and motherboard documentation, record the original settings, and return to defaults if the system becomes unstable; do not assume a universal performance gain.
Quick-Reference Troubleshooting Table
| Symptom | Likely Cause | First Step |
|---|---|---|
| Low FPS, GPU usage below its usual range | Several possible causes | Check caps, V-Sync, per-core CPU use, clocks, temperatures, and frame time |
| Low FPS, GPU usage near full | Possible GPU limit | Compare lower GPU-heavy settings before considering hardware |
| Stuttering with normal average FPS | Several possible causes | Check frame time, memory pressure, storage latency, drivers, and temperatures |
| FPS drops in busy scenes | CPU bottleneck | Lower NPC/physics settings |
| High temperatures with falling clocks | Possible thermal limit | Compare with model-specific guidance; follow the product manual or use a qualified technician for service |
The Bottom Line
Identifying a limiting component requires more than one utilization percentage. Start with frame-time and utilization monitoring, repeat the same test consistently, and use our calculator only as a normalized-score comparison. A GPU reaching full utilization can be normal for a graphics-heavy workload, but it does not by itself prove that the entire system is healthy.
Regular monitoring and periodic hardware checks will help you stay ahead of performance issues and make informed upgrade decisions.
Continue your PC planning
Use the guide as context, then test the decision with a focused calculator or a worked build example.
Relevant calculators
Share this article
Related Articles
How to Estimate Gaming FPS—and Why FPS Calculators Have Limits
A calculation-first guide to estimating average FPS and 1% lows, identifying CPU and GPU limits, and understanding where predictions stop being reliable.
CPU vs GPU Bottleneck: What's the Difference and How to Fix It
CPU bottleneck or GPU bottleneck? Learn the key differences, how each affects your gaming FPS, and the best strategies to resolve them.
How to Check FPS on PC: 6 Easy and Reliable Methods
A practical guide to displaying FPS, choosing the right overlay, measuring average and 1% low performance, and avoiding misleading tests.